The Impact Of Business Intelligence On Decision Making
By Harnil Oza

Business Intelligence (BI) is the process of analyzing and converting raw data into actionable and coherent information for analysis and decision-making. Leveraging BI solutions can help your organization enhance performance and increase their business output by many folds.
Over the past few years, machine learning and enhanced analytics have ushered a new era for business intelligence. They have revolutionized how we treat data and helped us to utilize data as a resource.
Spreadsheets no longer serve as the basis for analysis.In contrast, companies favor insightful visualizations and interactive dashboards to help them gain a deeper understanding of business components.
Business intelligence continues to evolve and tools become more customized for specific domains. As a result, businesses of all sizes are now able to leverage the power of analytics and access specialized BI solutions.
However, the most significant impact of business intelligence has been in the domain of decision-making. With the help of advanced analytics, business executives now have the power to leverage data and acquire insights to make informed decisions. In this article, we will discuss the role of business intelligence on decision making.
The Data Explosion
The explosion of data in the past decade has been one of its key highlighting features. With the help of the internet, the world has become more connected than ever before. Everything from commerce, education, and social interaction to software, business platforms rely on the internet to function without borders.
The advent of social media and e-commerce has boosted the influx of data. Furthermore, since mobile devices became smart, they too became tools for collecting, storing and transmitting data.
According to Statista, our global storage of data was around 2 Zettabytes (two trillion Gigabytes) in 2010. However, by 2015, the world storage of data had increased eight folds and reached the figure of 15.5 trillion Gigabytes in the span of just five years.
With each passing year, the number of channels that generate data continues to increase. The concept of the Internet of Things has enabled all kinds of devices to behave as smart devices and gather, process, and generate more data. As a result, stored data continues to increase at an astronomical rate.
As per 2019, the total publicly known data stored has amounted up to 41 zettabytes. Despite efforts to discard useless data and efficient data management, global public data is expected to reach 175 trillion gigabytes by 2025.
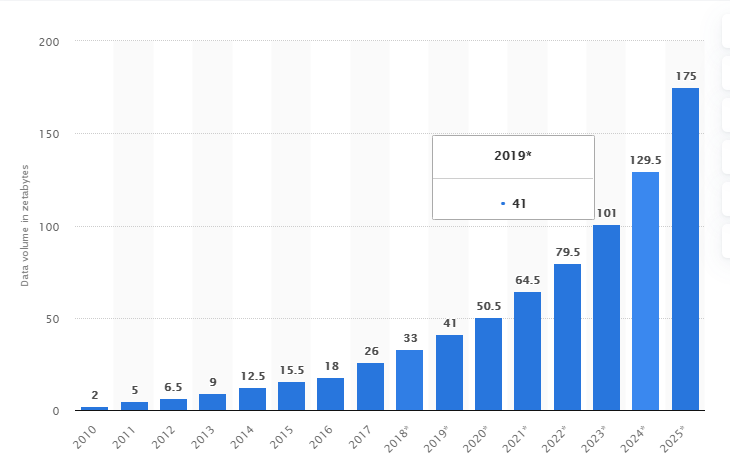
(The global public data volume in 2025 will increase to approximately 175 8zettabytes, which is 11.29 times more than the data volume in 2015. [Image Source])
One of the reasons why the volume of data is increasing at an unprecedented rate is that companies have started to realize the importance of data. Before, most companies used to store data just for the purpose of compliance and recordkeeping.
However, nowadays, companies realize the importance of data. As a result, they put significant effort into storing data that is useful, which ultimately contributes to the growth of data volume worldwide.
The Role of Data in Business Intelligence
Due to the importance of data in today’s business environments, there is no surprise that data is considered the new oil. Data plays a key role in fueling the corporate world and running the digital economy. The reason why experts call started to call data the new oil is that it has the most useful commodity in businesses.
In the past, the most successful companies in the world were often the ones that dominated the oil trade. Since oil was the commodity that literally fueled the economy, companies that enabled its trade was always successful. Similarly, nowadays, companies that control and utilize vast resources of data have certain leverage over companies that don’t.
Nowadays, a successful business relies on data to get a deeper understanding of their business processes and customers. Companies use various data collection techniques to gather the data they need, including recording calls, taking surveys, storing emails and chat conversations.
With that said, data, much like oil, is not useful in its raw form. Raw data has a lot of potential for providing value to businesses but needs to be refined before companies can benefit from that potential.
After data extraction, companies need to perform data cleaning and refine the data into a usable form. For this, they need to structure the data and remove the discrepancies within it. These discrepancies can range from missing values and attributes to redundant pieces of information that affect the quality of data.
Since the data gathered by these sources is never homogenous, businesses need to save and manage the data in multi-dimensional databases. Following that, IT professionals, business analysts, and data scientists standardize, load, and organize the data according to their needs for further use and analysis.
With the help of this data, experts can focus on monitoring datasets,track progress on business goals using key performance indicators (KPIs).The data gives experts information to detect emerging trends and patterns that were previously hidden inside the dataset.
Methods such as classification, clustering, and regression analysis are instrumental in recognizing this crucial information. Furthermore, techniques such as association rules, outlier detection, and sequential patterns also help experts in finding useful insights in the data.
In other cases, data can even help companies make predictions and forecast changes by building models and establishing rules to learn from input data.
Although dashboard and reporting capabilities remain are the central features of business intelligence, businesses are transitioning to more robust applications. Nowadays, businesses have shifted their focus from internal data gathered through ERP systems and data warehouses.
Instead, they are now using external data sources such as social data, maps, and historical readings from government data as resources for detailed analysis and forecasting.
A 2016 survey revealed that the majority of respondents (57%) chose sales planning and forecasting as a major application of business intelligence. Besides that, business intelligence was found as a major contributor in applications such as customer behavior analysis (40%).
.png)
(Sales planning and forecasting is an important application of BI as it helps businesses to better prepare for expected scenarios. [Image Source])
The Impact of Business Intelligence on Decision Making
Whether it is financial accounting, storage costs, or inventory management, organizations require access to reliable data. Companies are increasingly using business intelligence for processes such as data integration, data warehousing, data preparation, online analytical processing and data presentation.
These techniques eliminate the need for a manual gathering of data, which always prone to errors. Since data from various sources along with all metrics are merged into a single system and resource, it is easy for companies to manipulate and use the data in any desired combination.
As a result, business intelligence plays a vital role in decision-making for businesses. Therefore, all large enterprises rely on business intelligence to leverage their vast resources of data and learn to use them optimally.
In the past, the effort and corresponding costs needed for the implementation of BI solutions made it exclusive to large organizations. With time, the availability of tools and libraries for data analysis and model building has enabled small businesses to make the most of this revolutionary technology.
Nowadays, businesses of all sizes, including startups, have the ability to leverage BI solutions to gain a competitive advantage over other businesses. A BI solution helps automate several manual processes and extracts data from billing systems, excel spreadsheets, and websites to save them in a new database. This process not only requires less time but also minimizes the usage of human resources and the errors committed by them.
Therefore, there is no surprise that one report suggests that an overwhelming majority of small businesses and startups leverage business intelligence for various applications such as data analytics (97%).The second most popular use of BI for startups is reporting and distribution, which ranks at 84%. Besides that, applications such as managed dashboards (60%), planning and budgeting (58%), forecasting and constructing planning (49%) are also a major application of BI in small businesses and startups.
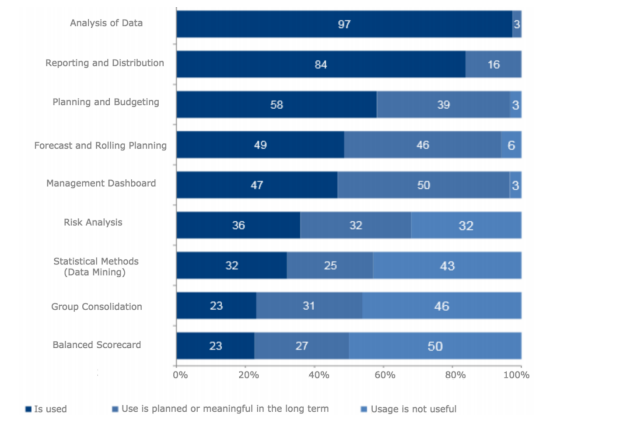
(Sales planning and forecasting is an important application of BI as it helps businesses to better prepare for expected scenarios. [Image Source])
Here are some of the main components of business intelligence that influence decision-making in various ways:
Data Quality Management (DQM)
Business intelligence coupled with data mining has influenced the quality of data significantly. With the help of business intelligence, it has been easier to analyze and extract value from multiple sources of data.
Usually, data gathered at high scales have a number of errors and that often leads to low-quality reports. The disparity of sources and data types in the available information adds to the complexity of data and makes the process of data integration challenges.
One survey performed by the Business Application Research Center found that data quality management would become the most important trend in 2020. Gathering as much information as possible is essential for having the correct information. However, unless the quality of data is not optimal and it doesn’t contain the relevant context, the data is not usable.
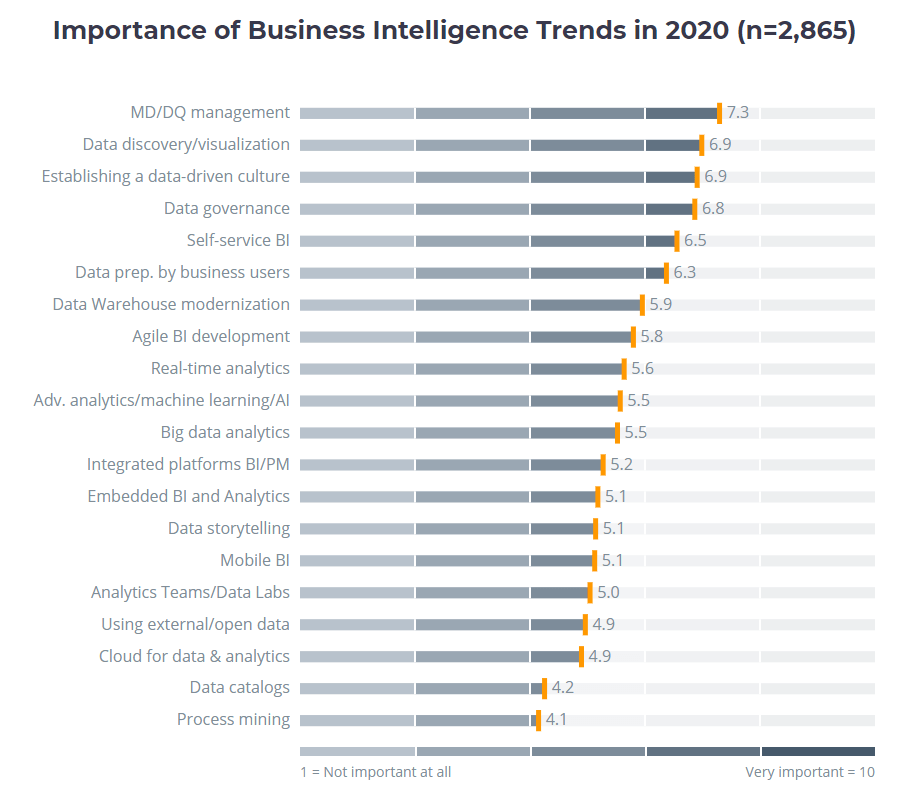
(According to the survey, respondents rated data quality management as the most important trend in the upcoming year. [Image Source])
The quality of data used in analytics directly corresponds to the process of decision making in an organization. Gartner has estimated that poor data quality is the reason why businesses all around the world have to bear losses of up to $15 million on average per year.
The incongruity of data affects the accuracy of the information in a given dataset. Since the information in the dataset is not a hundred percent accurate, they are not able to identify the underlying key performance indicators (KPIs). As a result, it is difficult for executives to make sound assumptions and end up with correct business decisions.
For this reason, processes such as Data Quality Management are significant to the decision making. It consists of steps such as data extraction, data distribution, along with the management of data oversight.
Data quality management is essential for securing the initial investments in a business. Good quality data not lay a strong foundation for insightful data analysis but also helps businesses meet strict standards of compliance regulations.
Key processes of business intelligence allow companies to have a good quality of data that ultimately leads to maximizing profits returns for the organization.
Data Visualization/Discovery
Data visualization or discovery is a key component of business intelligence and has an enormous impact n the process of decision making in an organization. The reason behind this is that visualizing data makes it much more comprehensible to executives.
In fact, our brains have the capacity to process visual information a lot faster than text. Since almost 70% of all our sensory receptors are located in our eyes, it is no surprise that we are able to understand a visual scene in less than 1/10th of a second. Not only can our eyes process visual images faster than text, but it also relies on visuals for 90% of the information acquired by the brain.
Therefore, with the help of business intelligence, companies can gain access to proper data visualization. As a result, they are able to see potential connections and relationships in a given dataset.
These kinds of relationships are not obvious when data is present in textual information. However, after converting the textual information to visual charts, it is for executives to patterns, correlations, and outliers that represent the relationships between KPIs.
Furthermore, these visualizations help executives identify factors that fall outside the usual perimeters of information and have the ability to affect their businesses in significant ways. For this reason, the survey conducted by the Business Application Research Center lists data visualization as the second most important phenomenon in 2020.
At the same time, data discovery has been one of the most significant trends in the past few years. Any company that leverages business intelligence also uses data discovery and visualization tools for in-depth insights into data. According to a report by BI Survey, 79% of the respondents were either using data discovery tools or planning to use it in the future.
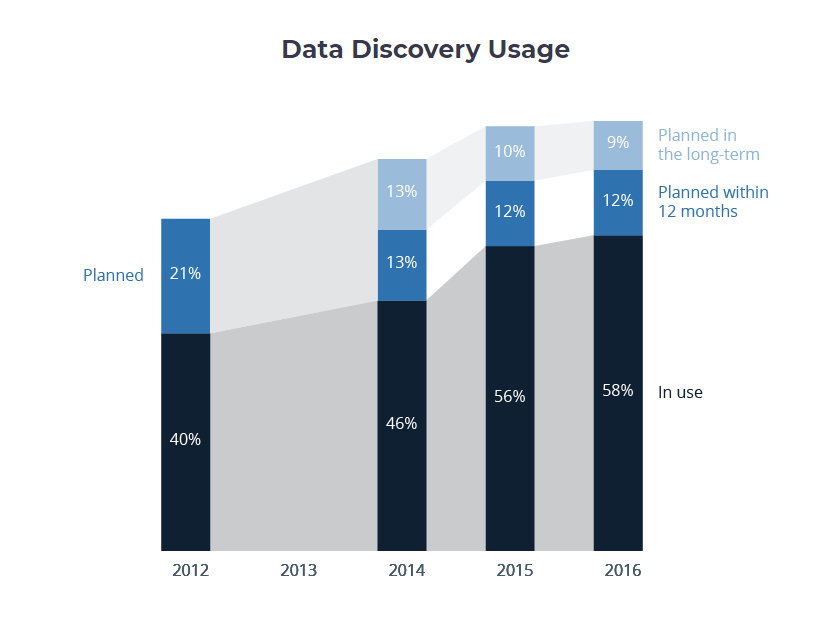
(The survey showed that the acceptance of data discovery tools increased by 18% four years between 2012 and 2016. [Image Source])
Data discovery tools allow business owners and executives to gain a comprehensive overview of the data with the help of data discovery and visualization tools. As a result, they are able to understand the business processes, KPIs and their relationships much more comprehensively. Thus, it helps them make decisions derived from given data.
Since the technique utilizes existing data and helps companies gain a comprehensive overview, the technique is termed as descriptive analytics. Being able to see existing trends in business operations with the help of data enables executives to take necessary actions immediately. Thus, these executives are able to better manage any anomalies they come across while running their businesses.
Artificial Intelligence
Artificial intelligence is one of the greatest feats of technology humankind has achieved. Our ability to make machines intelligent allows us to automate mundane tasks and relay them to machines that can perform them more efficiently.
According to Gartner’s 2020 Strategic Technology Trends report, artificial intelligence will be one of the most crucial technologies for strategic planning in 2020. The reason behind this is that AI allows us to implement hyper-automation in business operations. As a result, companies are able to concentrate on core issues in a proper manner and address vulnerable points of attacks more comprehensively.
Despite what Sci-Fi movies would lead you to believe, AI at this stage does not have the ability to take over the world. Instead, artificial intelligence is a science that helps machines execute tasks that are usually performed through complex human intelligence.
In the scope of business intelligence, AI has tremendous scope in revolutionizing how we interact with data, perform analytics, and extract data from multiple sources. Artificial intelligence can help companies evolve from passive and static reporting and move on to proactive analytics.
This means that businesses can leverage AI to perform analysis of existing business operations and view ongoing processes on live dashboards. These automated systems allow business executives to stay in touch with all key business processes and monitor every crucial event as it happens.
Furthermore, these executives can embed advanced functionalities to optimize how they manage business processes. For instance, data scientists and machine learning engineers can develop intelligent models that can inform executives about key events in business processes, which have remained unnoticed, otherwise.
BI solutions based on AI algorithms such as advanced neural networks are fundamental in detecting anomalies with high accuracy. These algorithms are able to detect anomalies by analyzing and processing historical trends and patterns. As a result, these systems are able to register unexpected events in a business process immediately. After detecting anomalies, these systems will alert business executives, which will encourage them to take immediate action.
Another important feature that AI brings to business intelligence is the ability to provide high-level insights. Experts can automate AI algorithms to an extent where they can fully perform analysis on datasets automatically without requiring human intervention.
Companies only have to choose data sources they want to use, identify key attributes the algorithm has to prioritize. After that, the algorithm will perform calculations based on historical data and consequently spit out results that give business owners valuable insights.
These insights can vary from trends, growth predictions, forecasts and key segments correlations to value drivers, risky anomalies, and what-if scenarios that can harm the business if overlooked.
If these insights are backed up by comprehensive visualization, business owners can understand key insights easily without a strong IT background. Recent developments in BI solutions have made it possible for experts and AI systems to communicate insights to users in plain language.
AI assistants can respond to general queries entered by business users and generate the best possible answers in response. As a result, executives are able to gain access to high-quality insights, which can help business owners make the best possible decisions.
At the same time, phenomenon such as the Internet of things has enabled businesses to make most of real-time online data analysis. These devices leverage AI solutions on the edge to perform smart operations without needing extensive resources for processing.
They make it possible for experts to attain data from remote sites, which wasn’t possible before. Consequently, it is easier for BI experts to perform statistical analysis and make the procurement of data more efficient.
Furthermore, AL-driven solutions have the ability to accelerate the learning process by entering in a duel with other AI solutions. One way to illustrate this would be by considering an AI model designed to generate a realistic image. This model will analyze realistic images and identify key elements, which make the image seem realistic. Over several cycles of learning, the model will learn from existing data and gain the ability to generate realistic images.
On the opposite end, experts will design a model for detecting whether a given image is artificial or not. Like the previous model, this model will learn from existing data and learn the ability to identify artificial images.
Later, both of these models will be pitted against each other, where both models will be able to detect vulnerabilities in each of their systems and improve their own performance significantly. Dueling AI solutions like these can also help BI solutions to give highly accurate forecasting reports that lead to better decision making.
Predictive Analytics
A vast portion of research in business intelligence has been on solutions that have the ability to answer questions related to the future. Therefore, solutions that enable predictive analysis are gaining traction among business owners and BI professionals in the past few years.
Predictive analytics is the process of extracting data from current datasets and analyze them to detect and forecast future scenarios. The process is an extension of data mining – a phenomenon that plays a central role in making business intelligence solutions.
Predictive analytics are responsible for estimating future possibilities and thus, can have a high portion of errors in the initial phases. However, as experts increase the flow of data for these systems and connect them to large volumes of data, they are able to learn from the false predictions and gradually make improvements to their existing rules. With time and learning, these solutions can become smarter with their predictions and start to perform efficiently.
These solutions can indicate what may happen in the future with an acceptable level of reliability. Some solutions are even smart enough to detect alternative scenarios and perform risks assessment.
When applied to businesses, predictive analytics has the ability to analyze both existing and historical data to have a clear understanding of customers, products, and partners. These solutions are invaluable to modern businesses of all sizes and can help them identify potential risks and opportunities.
So there is no surprise that the market size for predictive analysis has increased exponentially in recent times. Statista reports that the global market size for predictive analytics has been increasing at the rate of almost $1 billion since 2017.
According to the statistic, the global market size for predictive analytics was $4.2 billion in 2017. The following year in 2018, it reached $5.1 billion while in 2019, it was estimated at $6.2 billion. Experts estimate the popularity of predictive analytics will reach to a market worth $10.95 billion by 2022.
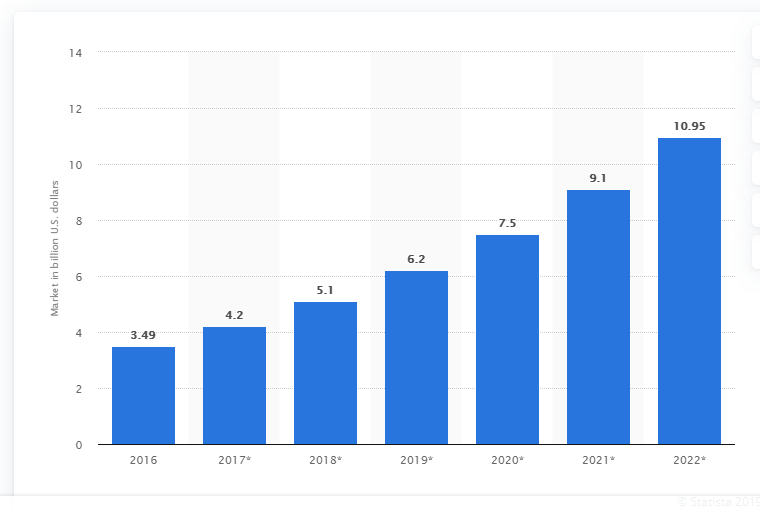
(From 2016 to 2019, the global market for predictive analytics has increased by $2.71 billion. [Image Source])
There are various techniques for making predictive analytics solutions. However, the most common methods used by machine learning engineers and data scientists are autoregressive integrated moving average (ARIMA), and artificial neural networks (ANN).
ARIMA is a highly complex machine-learning model designed for implementing time series analysis. Time series analysis is another term for the analysis of trends. The technique uses historical data from the past, applies it to model current data and then uses it to forecast estimates in the future.
The time series analysis inspects autocorrelations in a given dataset and compares how existing values rely on past values. The techniques also take into account how further in the past data it needs to go to make accurate predictions.
There are two integral components of the ARIMA process and they are responsible for different aspects of model creation. The autoregressive (AR) component is responsible for estimating current values by taking previous values into account. If the process finds any difference between the real value and the estimated value, the difference is adjusted using the moving average (MA) component.
Users can check whether these values are normal, stationary, or random, but they have to keep in mind that there is constant variation among these values. If the model can detect any deviation from these points, they can help it to predict unknown anomalies and hidden patterns in data that were not visible previously.
ARIMA is not easy and straightforward as other statistical approaches and it is extremely complex and difficult to draw conclusions. However, once you are able to grasp the fundamental understanding of principles, ARIMA can become a powerful tool for predictive analysis in business intelligence.
On the other hand, Artificial Neural Networks (ANNs) is a technique that mimics the functionality of biological neurons in the brain. The neural network is a computational model consisting of various layers.
Data is put into the model from the input layer and the information passes through every single mathematical neuron. Every neuron performs some kind of mathematical computation on the data and it gets changed each time it passes through a single neuron. This phenomenon is repeated until the data reaches the last layer.
The technique is slow in terms of computation but it can result in highly accurate results when applied for predictive problems. Experts can use neural networks for identifying associations and discovering regularities within a large dataset.
With that said, industries can also leverage predictive analytics in a more specialized manner. For instance, airline services can utilize these systems to predict what price they should set for tickets of a particular flight.
Similarly, large hotels can use these systems for predicting the number of guests they can expect in a given night. Doing so can help them to adjust prices while maximizing the occupancy of their rooms and increasing revenue at the same time.
With that said, the usefulness of these solutions goes beyond hospitality and service industries and any businesses can utilize them according to their requirements. This is why you can see marketers using predictive systems for determining customer responses or purchases while also setting cross-sell opportunities.
On the other hand, many banking services use predictive analytics to quantify and generate credit scores on applicants. The models can predict how ‘credit-worthy’ a particular applicant is for the loan application.
All of these applications of predictive analytic systems are rooted in the process of decision making. Predictive analytics are crucial components of business intelligence and helps executives make correct decisions according to any given situation.
Even if the prediction is not a hundred percent accurate, it narrows down options for people since the suggestions are rooted in data. Therefore, business owners and executives can always benefit from predictive analytics regardless of their situation.
Prescriptive Analysis
Prescriptive analytics is a more advanced version of predictive analytics and goes a step ahead into the future. The process utilizes existing data to find out which decisions need to make to achieve the intended goals. The process uses a variety of techniques to o[perform actions such as complex event processing, graph analysis, recommendation engines, simulation, and also neural networks.
While descriptive analysis is useful for giving insights by evaluating existing data and predictive analysis is responsible for forecasting possible outcomes, prescriptive analysis is given a much more specialized role. The technique is used for finding the best possible solutions when you are given a variety of choices.
Therefore, prescriptive analysis is most closely related to the process of decision making. The technique allows experts to analyze and estimate the effects of future decisions and make vital adjustments to have the best possible results. Although the process is related to descriptive and predictive analytics, it goes beyond monitoring and gives users actionable insights.
This is why prescriptive analytics is useful for tasks such as optimizing production, planning, inventory, and supply chain designs. Following the suggestions given by the system, can help companies deliver customer requirements in an optimal manner. Furthermore, prescriptive analytics empowers organizations to make decisions that address all future events or risks in the best possible manner.
The field relies heavily on domains such as computer science and mathematics, to create a number of different statistical methods. These mathematical models generate and regenerate expected decision patterns that can affect the business in the future.
Commonly, it is referred to as the final step of business intelligence. Although the market for prescriptive analytics is fairly new, the phenomenon is expected to gain traction in business intelligence in the coming years.
Gartner predicted that the market of prescriptive analytics would rise by almost 21% CAGR (compound annual growth rate) in the future. The company estimates that the total market for prescriptive analytics will reach $1.575 billion by 2021.
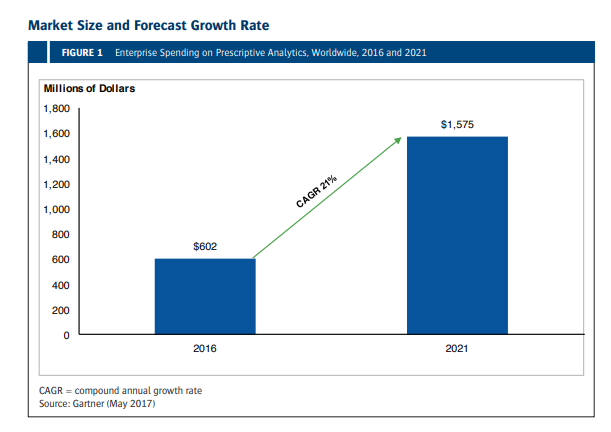
(According to Gartner, the market for prescriptive analytics can experience a growth of $973 million by 2021. [Image Source])
Because prescriptive analytic tools can resolve situations where there is substantial uncertainty, they are most useful in situations where executives have issues in making correct decisions due to a huge amount of variables.
Therefore, there is no surprise that prescriptive analytics is used in industries such as oil and gas management. In this industry, prices are dependent on fluctuating factors such as changing demand, environmental, and political scenarios.
Likewise, in the manufacturing industry, manufacturers need to consider a variety of factors that can help them to model prices accurately. Therefore, executives in this sector have to make decisions regarding production, storage, and new ventures and produce a profit margin for the business.
Due to the potential of growth, prescriptive analytics can bring about in the manufacturing sector; Allied Market Research has predicted that the market for prescriptive analytics in manufacturing will reach $2.52 billion by the year 2026.
Another major public sector where prescriptive analytics aids decision making is the healthcare sector. Business intelligence solutions can help patient care and healthcare administration systems to make better decisions regarding the allocation of resources and improving clinical care.
Similarly, insurance companies can leverage prescriptive BI solutions to improvise risk assessment models and make better decisions regarding premium pricing after analyzing pricing information.
Pharmaceutical businesses can utilize prescriptive analytics as well for identifying the most optimal testing cohorts for carrying out clinical trials. Using prescriptive analytics can helps pharmaceutical companies to minimize the cost of testing and expedite the process of developing and approving a life-saving drug.
Prescriptive analytics can influence decision making in a number of other industries such as management of equipment and maintenance, choosing locations for exploration and drilling sites, as well as making better decisions regarding drilling and exploration locations.
Mobile BI Solutions
Nowadays, the workforce is becoming more mobile than ever before, especially in enterprises. As a result, business intelligence solutions are conforming to upcoming changes and becoming suitable for mobile devices.
With the help of mobile BI solutions, knowledge workers can gain access to and analyze data on mobile devices. Users can benefit from data alerts, evaluate critical insights, and share these insights with other team members on the edge.
As a result, businesses can access new resources of information, consume and process information and utilize useful insights in organizations of all sizes. These applications can be provided to mobile devices, and companies that don’t have advanced analytical in-house resources can also benefit from them.
The reason why mobile business intelligence solutions are useful for companies is that they can revolutionize decision making at the granular level. In business environments where field executives have the autonomy to make decisions, mobile BI solutions can help them choose the most optimal solutions for a given problem.
These executives always access to data and insights they need to optimize the business processes in the field. By using data-driven solutions, they can enforce the changes they want without any delay. Furthermore, emerging data preparation features now enables users to make most of self-service in business environments.
Therefore, there is no surprise that current business intelligence market trends predict that mobile BI solutions will continue to prosper at CAGR of 22.43%. The global market for mobile BI solutions stood at $6.18 billion in 2018. If the company continues to grow at the current rate, it can expect to reach a market size of approximately $17 billion by 2024.
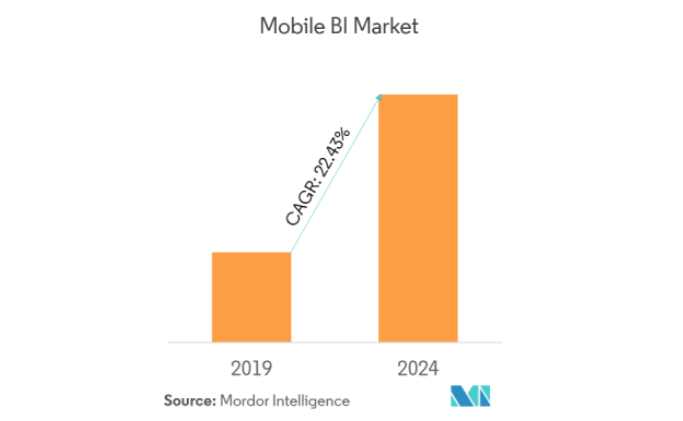
(Despite challenges in the implementation of mobility solutions, mobile BI solutions have attained a CAGR of 22.43%. [Image Source])
Conclusion
Business intelligence is crucial to extract critical information from everyday business processes from vast amounts of unstructured data. It helps companies transform unprocessed data into actionable insights, which can help them make data-driven strategic decisions and improve operational and business productivity.
All components of business intelligence are necessary for revealing underlying trends in data; optimize ongoing business processes and analyze feedback given by customers. Smart utilization of BI solutions leads to faster reporting, analysis or planning of available resources in a given business. Since the insights given by these solutions are derived from real-time data of the business processes, they are more accurate than other estimations.
At the same time, businesses can improve on crucial components of their business such as data quality, employee satisfaction, operational efficiency, and customer satisfaction. These processes hold immense value and can help business owners to come up with decisions in the most optimal manner.
Furthermore, better decision making helps businesses in gaining a greater competitive advantage than their peers gain. They are not only able to save costs by the smart allocation of their resources but also earn greater revenue by investing in more fruitful business opportunities.

Harnil Oza
| AuthorHarnil Oza is a CEO of Hyperlink InfoSystem, a mobile app development company based in USA & India having a team of best app developers who deliver best mobile solutions mainly on Android and iOS platform and also listed as one of the top app development companies by leading research platform. He regularly contributes his knowledge on the leading blogging sites.
Recent Blogs
View More.jpg "Guide to Create a Real-Time Planetary Transit Web App")
Step-by-Step Guide to Create a Real-Time Planetary Transit Web App
By John Meth | 09-07-2026
.jpg "How AI Is Already Affecting Web Design")
How AI Is Already Affecting Web Design
By Damien Woods | 09-07-2026

How Shopify Apps Enhance Customer Experience
By Emily Byers | 08-07-2026
Explore Top 10
View More
Top 10+ Xamarin App Development Companies in Zvishavane District | Xamarin App Developers Zvishavane District 2022
Top App Development Firms | 05-08-2022
Top 10+ Xamarin App Development Companies in Shurugwi District | Xamarin App Developers Shurugwi District 2022
Top App Development Firms | 05-08-2022
Top 10+ Xamarin App Development Companies in Shurugwi | Xamarin App Developers Shurugwi 2022
Top App Development Firms | 05-08-2022